 Mastodon
Applications compiled for the HV2 target platform may be run on the HV2 emulator “hv2e32”. The emulator may run immediately via the “- -Run” command line option or started manually with the [F5] key.
1. Boot Sequence
The operating system “HV2OS” is loaded from its image file “HV2OS.hv2” into program memory & started at address offset #0 (it is possible, to supply a different image - if it is compiled non-relocatable for address zero …).
The emulator searches for a local block device image file “hd1.blkdev”. If none is found, a new one will be generated & formatted with the HV2FS file system.
Next, HV2OS tries to boot the first application, “Shell.bin” from the block device. If none is found (like on a newly formatted drive), the system halts right here.
If “Shell.bin” could be booted, a command prompt permits further user interaction (try “help”!). Especially, other binaries (pre-loaded via “make hv2” from within there respective directories) may be run. Use “ls” to list disk content …
If “hv2e32” had been started with the colour graphics device option (–CGD), the shell automatically detects the CGD existance and switches to the colour screen. To switch between B/W screen & CGD, use “scr 0” and “scr 1” on the command line respectively.
2. Testing
A running application may be interrupted with the [F6] key. Also, an application under test may call itself “Sys.bkpt()” and stop at a defined line of code. In the latter case you will have to press [F8] to exit the breakpoint function and observe the next line of code.
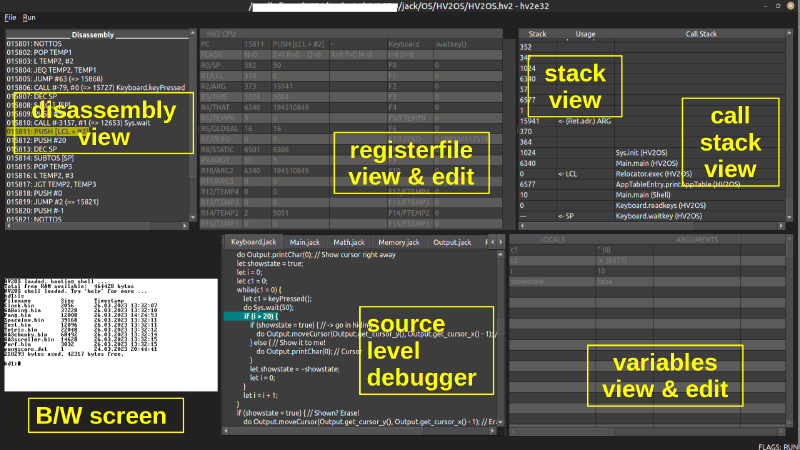
Details are available via (in display order):
- the disassembly view (s.a.), indicating the next HV2 opcode to execute
- the register file, showing all HV2 CPU registers (and yes, they may be modified right in place!)
- the stack view, showing the current stack usage (SP at the bottom of the display)
- the call stack, actually a filter for the stack view, showing the nested function calls (current function at the bottom) w/ their symbols
- the (original “hack” platform) B/W screen with its output
- a source lines display (if available, see compilation options in the docs)
- a variable display, showing all variables in scope (local, argument, instance & static) - and yes, they may be modified right here!
Function keys supported by the emulator (see “Run” menu) are:
[F4] Restart/reset emulator (Note: Will reset profiling counters!)
[F5] Run or continue executing
[F6] Stop executing
[F8] Assembly code single stepping
[F9] Assembly code “step over” (execute the function & stop on return)
[F10] “Next line”, execute the current source line & stop thereafter
[F11] “Stop at selected line”. First, mark a target line w/ the mouse, then [F11]!
[F12] “Step out of function” will try to continue execution until the current function is left
On the “File” menu, other features can be found:
Load (Re-)Road the *.hv2 file
Disassemble Dump program memory as disassembly
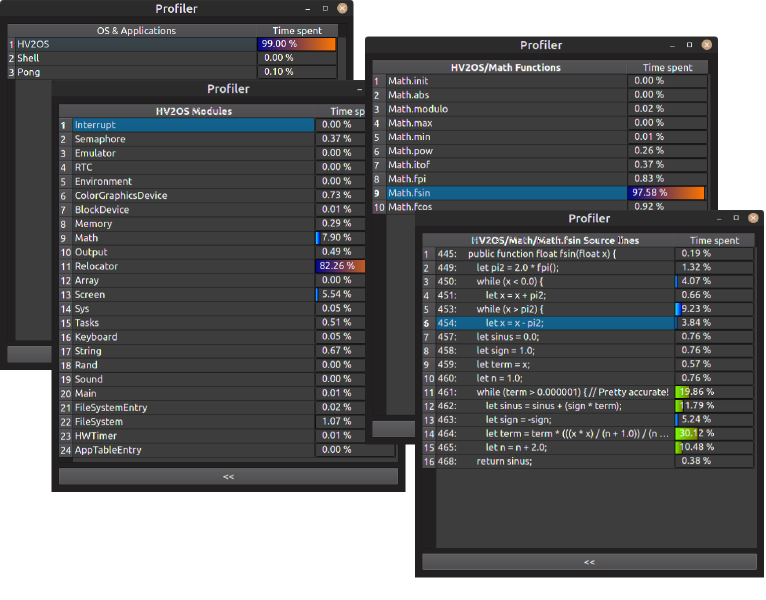
Profiler stats Shows a profiling snapshot (click on lines to drill down from application to module to function to source line level)
Exit Guess, what!
Profiler window details:
A sample dev cycle session will give you an idea, how the emulator may be used for development testing:
3. Documentation
More details can be found in the documentation of the XJack project.